-
 Project Curve Tracer: Design Refinement
- Date Tue 07 June 2016
- By Jason Jones
- Category curve-tracer
- Tags curve-tracer c curve tracer python project tkinter
Design Refinement
There have been a couple more patch wires and a bit of scope creep, but no show-stoppers and a fair amount of added functionality.
Since the last post, we have:
- Added an offset calibration mode which removes any voltage offset that may exist
- Added a three-terminal mode which is intended for driving MOSFETs and changes the display to a 'drain current' view
- Added a "gate drive" function which whill adjust a MOSFET gate (or transistor) at a particular voltage.
- Added a complete waveform adjustment window
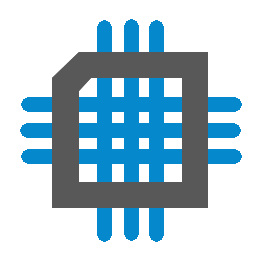
- Changed the display to points instead of lines (the lines were great, but they gave a false impression of having a lot of data that may not have been there)
- Added status data for each of the above functions
- Added an XY mode so that you can use the curve tracer with an oscilloscope without having to use your PC.
Lets go through each of these functions and discuss.
Offset Calibration
When the vertical scale was 8-bit, there was a noticable 'stepping' that occured and the samples didn't appear quit as close to '0mA' as they should have. As a result, I added an offset calibration that should only be run when nothing is connected. This function removes the offset.
In truth, since increasing the data resolution, this functionality is not entirely necessary, but having not tried a large number of units, we should leave it in for now.
Gate Adjustment
In order to check out a MOSFET or transistor, a third voltage or current must be available which can drive the third leg. This is where the gate voltage adjustment comes into the picture. This feature has been supported in hardware since the design inception but has not been utilized until recently. As can be seen below, the
2-Terminal/3-Termainal Modes
This feature allows the user to switch between the standard two-terminal probe setup and the three- terminal MOSFET/transistor mode.
When in two-terminal mode, a sinusoidal output - positive and negative - is placed across the probes. This gives the 'standard' curve traces that are usually observed on curve traces with probes.
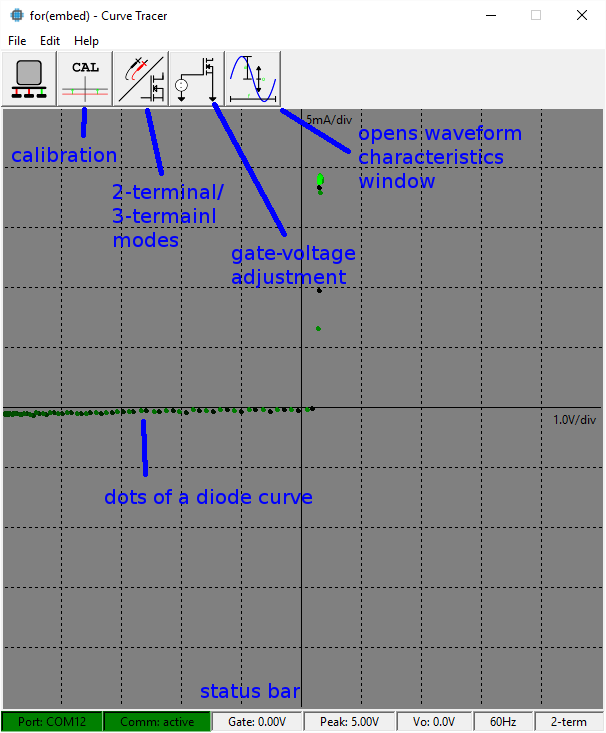
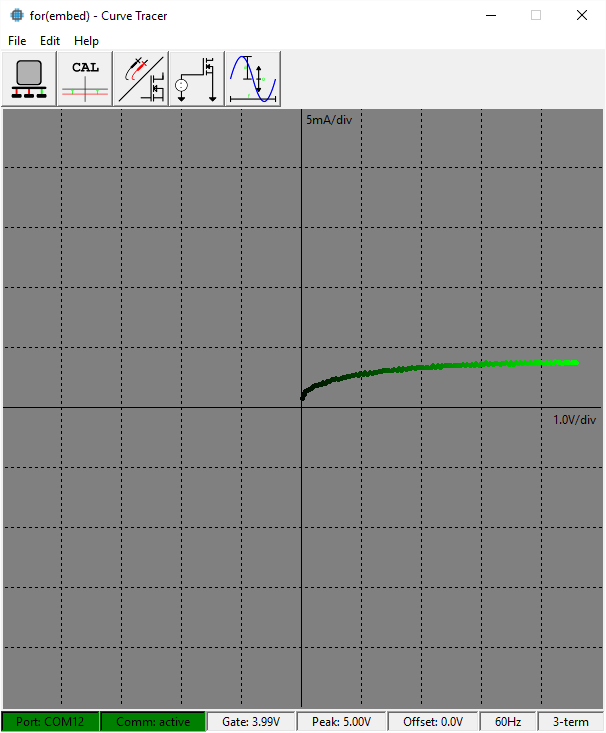
The three-terminal mode will pull V- to ground and V+ will have a triangle waveform applied to it, so the voltage applied across the D/S of the MOSFET is always greater than or equal to zero. The user may then adjust the gate voltage as they see fit and observe the drain current. This will crudely reproduce the curves that are so common in MOSFET/transistor datasheets.
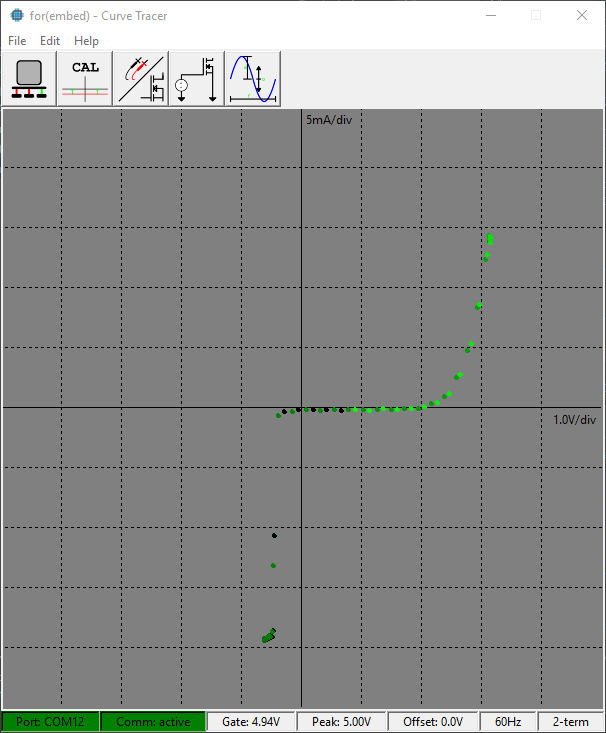
Note in the status that both shots have a gate voltage of 5Vg applied. For comparison, we have an extra pic with 4.0V applied to the gate:
I would like to keep the C code to a minimum on this project since the microcontroller only has 16kB of program memory, so it would be great in the future to add a button on the GUI that will command the microcontroller to go to different voltages and draw out the different curves all on one plot. This wouldn't be a difficult task, but is still straying a bit from the core functionality that we are trying to add.
Waveform Adjustment Window
Initialially, there were individual buttons for amplitude, frequency, and offset. Once it started to look a bit crowded, I integrated these functions into a single window interface along with a little graphic to assist the user.
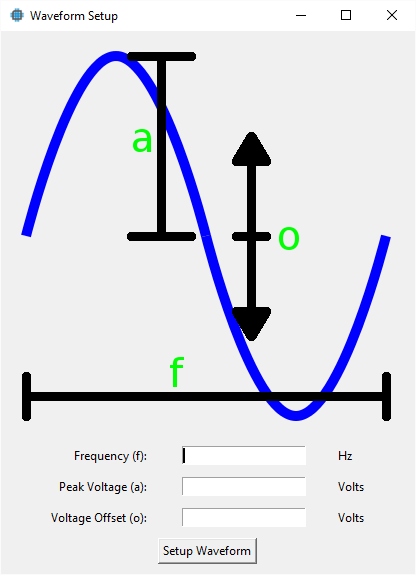
I chose to use peak voltage instead of peak-to-peak voltage because many users may be interested in the highest voltage that will be applied to their assembly. Some users may only wish a maximum of 1V be applied, so this interface allows that adjustment with little thought. For those with more EE-fu, you can easily double the number and know where you are going.
Status
For most of the above functions, we have added Dispatch messages to be sent to the GUI periodically so that the GUI status may be updated. There is some code involved, but the dispatch and serialdispatch libraries have really helped with communication between the PC and board.
XY Mode
At some point today, it struck me that many people using this will probably already have an old oscilloscope or two laying around and that I should place a couple of dedicated XY-mode outputs for that purpose. I still feel a bit nostalgic when thinking back to my huntron tracker CRT screen. So I found a couple of unused PWM outputs on the microcontroller that will mirror the differential voltage and current and filtered them using a few extra RCs.
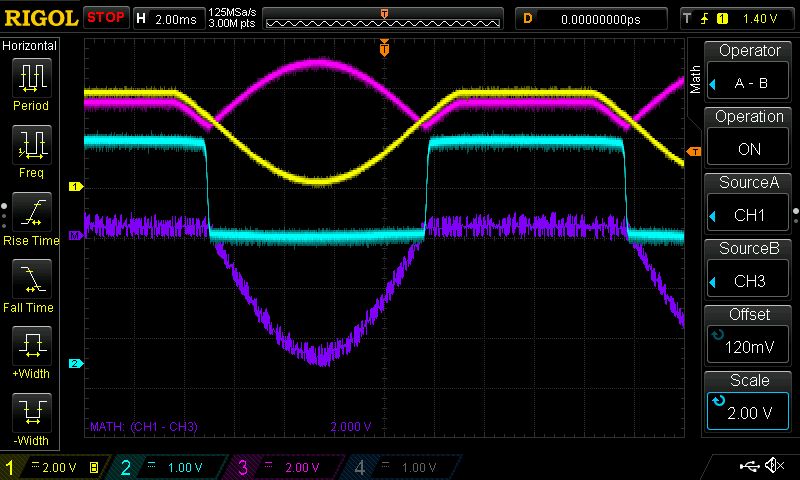
My initial thought was was just place the X probe on the positive output voltage and the Y probe on the output of the current-to-voltage amplifier. When I mated these to the XY mode of my oscilloscope with a diode load, I saw an unexpected waveform on the oscilloscope:
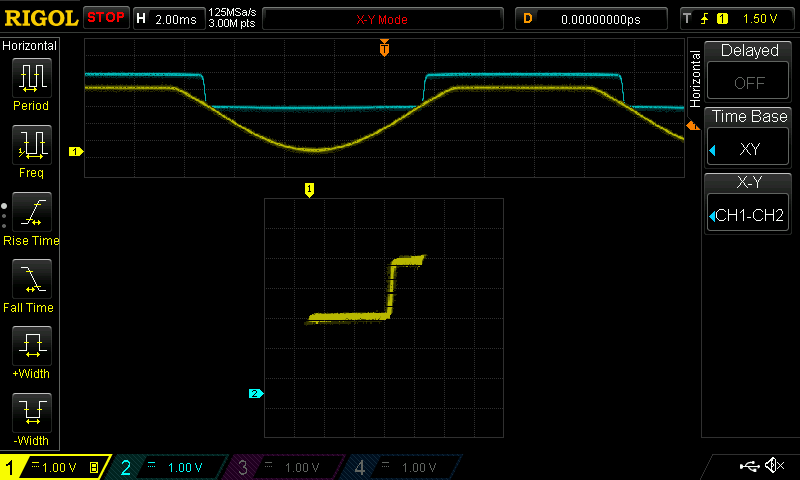
Note that I adjusted the vertical scale of the traces down by 2.5V in order to center the waveforms since the scope is measuring absolute voltage rather than relative voltage.
What is that funny tail at the top right? My GUI showed a much more conventional trace:
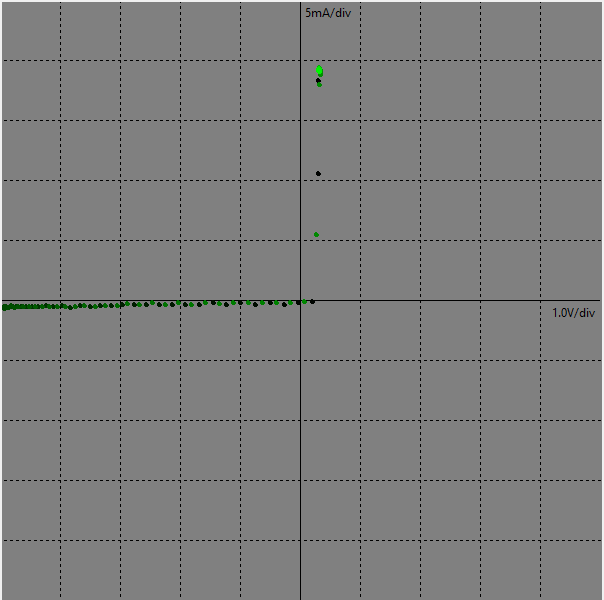
After a few minutes of head-scratching, I realized that the curve tracer microcontroller is measuring the differential voltage across the component while the oscilloscope was only measuring the positive. This is valid for light loads, but anything that saturates the opamp is going to have the incorrect tails. A look at both voltage traces reveals that the differential voltage is actually quite small during the near-short circuit caused by the diode, but this is not taken into account when the scope is only attached to one output lead.
The solution is to pipe the differential voltage and the current through the microcontroller and to a couple of analog outputs.
In this case, we don't have any more analog outputs, but we do have a couple of unused digital pins that we
can easily appropriate for the task.
This is the largest scope creep that has entered the project thus far, and really isn't that much. The microcontroller limitation has been demenonstrated to be the ADC and not the level of processing, so adding a couple more peripheral loads will impact our project minimally.
This has the added benefit of being able to operate the curve tracer in any standard lab without having to fire up a PC, which is the primary reason that I added the feature. Sure, you won't be able to adjust the frequency or amplitude, but 95% of troubleshooting is done at the 60Hz, +/-5.0V setting anyway, so this is perfect.
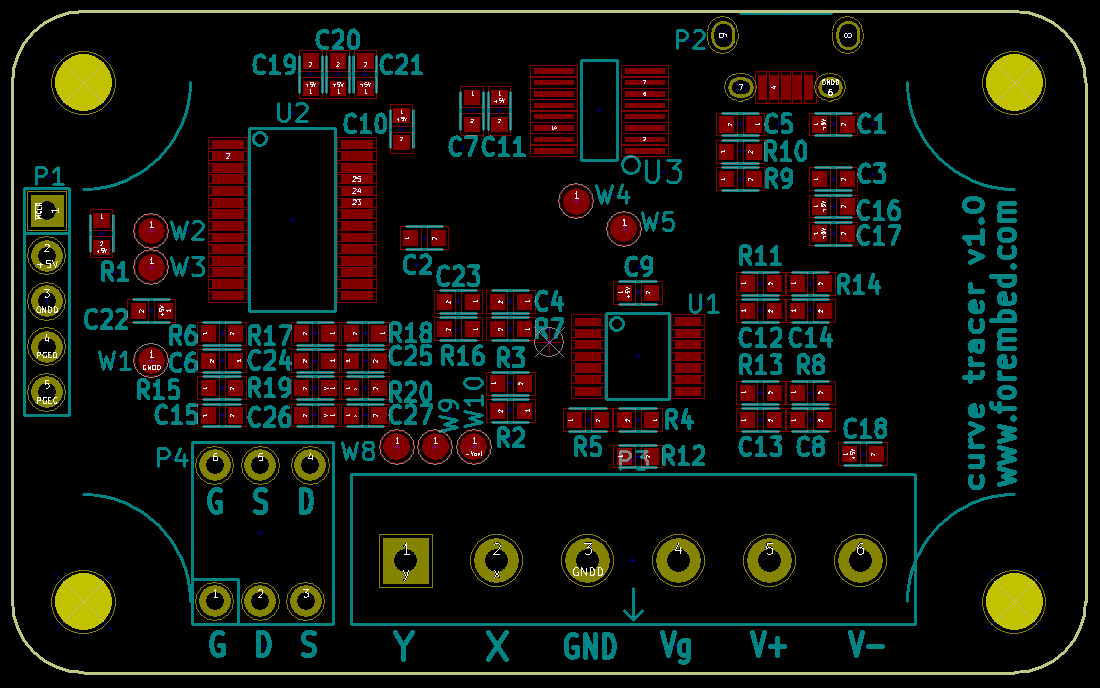
As a result of modifying the schematic, we had to adjust our layout a bit to add the extra screw terminals:
Where To Next?
We are working towards a complete version 1.0, but first, we need a couple more features to be fully set. I believe that the hardware is already at that 1.0 mark, but the software is where we need a bit of work. I would like to have the ability to put several 3-terminal voltage lines on the screen at one time. I would also like the ability to save and recall waveforms as-needed.
I will give it a couple of days before calling the hardware complete. Once I am at the point that all hardware and software is at the releasable level, then I will tag the repository.
- article
- current-sensor
- curve-tracer
- dispatch
- fan-controller
- fixed-point-math
- load-cell-sensor
- meta
- reference


 RSS
RSS
2
assembly
5
buffer
31
c
3
current sensor
28
curve tracer
2
fan controller
6
fixed-point math
4
interrupt
3
KiCAD
3
labview
5
layout
6
msp430
4
pelican
18
pic24
29
project
12
python
2
Q1.15
4
schematic
10
serial
3
solidworks
2
task manager
2
theme
3
tkinter
9
uart
9
xc16